Shopify Web Performance Dashboard

Use Core Web Vitals in the Shopify backend

The new Shopify Web Performance Dashboard is part of the Editions Winter 24 update. That’s why we take a closer look at it in this video and explain what Core Web Vitals are, how you can use them and where you can find them.

Shopify web performance dashboard is part of the new update

If you missed our summary for the new Shopify Editions Winter 2024 update, here is the link for you again.
The new dashboard offers some changes, as you can see here. But how can you access it now?
Either via the theme menu or Analytics and Reports. The speed scores you may be familiar with are now history.
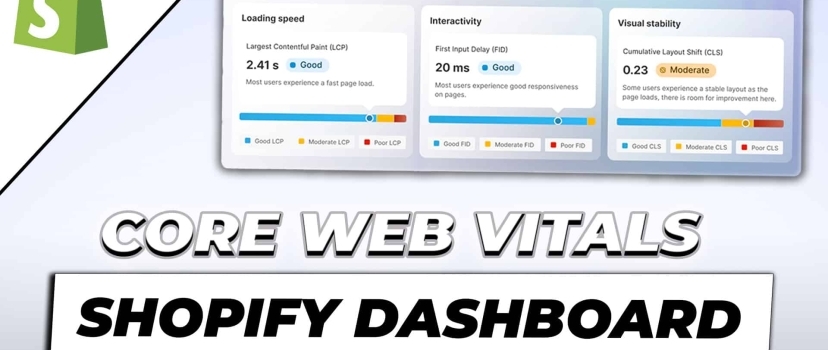
Instead, Shopify is based on the industry standard, the Core Web Vitals. These were introduced by Google in May 2020 and are the central KPIs for measuring the performance of a website. This means that these values are an official ranking factor. The three values LCP, CLS and FID are now also displayed directly in your Shopify backend.

What are the Core Web Vitals?

Largest Contentful Paint stands for the loading time of a page from the user’s point of view. This means the time from clicking on the link until most of the content is visible on the monitor. Cumulative Layout Shift in turn stands for layout stability. So if there are visible elements in your store that change their position during the loading process, Google will penalize this and you will achieve lower rankings. First Input Delay also measures the loading time like the CLS, but with regard to usability. The FID therefore measures the time that elapses before any interaction can take place in the store. It therefore describes the time that elapses between the first user interaction on a website and the browser response to this interaction.

Core Web Vitals Summary

In summary, this means that Google strives to offer the user a user-friendly presentation and use and therefore prefers stores that adhere to this with good rankings in the SERPs.
You will notice that the 3 KPIs are named differently in the theme menu, don’t let this confuse you.
Loading Speed is therefore the LCP, Interactivity is the FID and Visual Stability is the CLS value. These are then ultimately presented in three evaluation metrics – Good, Moderate and Poor. So good, mediocre and in need of improvement.

Shopify web performance dashboard - how the analysis tool works

But what can you do with the data? If you click on it at the top right, you will see a diagram showing the respective KPI value in relation to the time. You can therefore draw conclusions as to whether the value was poor on days on which you, for example, had a low blood pressure. you have installed new apps, carried out a theme update or the new coding is making your store slower. You can also use the diagram below to view your traffic, i.e. how many site visitors used your store on which days and what the distribution is according to Good, Moderate and Poor Experience.

Shopify web performance dashboard - optimize your store

But how should you optimize your store?
There are two approaches to this. The first question would be: “Do you have enough traffic?”.
If you have fewer than 100 page visitors, you should focus more on increasing traffic than working on page speed. Do you have enough traffic, but customers are not buying?
Then you should tweak every Core Web Vital parameter that is not declared as “good”. Ex. by optimizing the code, using a compression app for images or paying attention to layout shifts and eliminating them.

Shopify Best Practices

Shopify also provides you with best practices for this, which you can view in the report menu. Marketing / monitoring and performance often compete with each other. Many tracking pixels that analyze the page behavior of users can also slow down the store. Or unused apps that take away unnecessary performance. What we always preach is responsiveness. This means that images look perfect both on the desktop and on the cell phone and that text sections are not shifted. In addition, it often happens that the text-to-image ratio is good on the desktop, but too much text appears at once on the cell phone.

Shopify agency

These are definitely a lot of potential construction sites, some of them complex, that demand a lot of skills from the store operator.
Since this is hardly feasible in practice, Shopify itself recommends getting help from certified Shopify partners.
If, thanks to this article, you have discovered that there is still work to be done in your store, then we at eBakery will be happy to help you eliminate the problems. After all, what sounds analytical and theoretical is actually a loss of sales caused by poor rankings, poor user experience and slow loading times.
Make an appointment with us directly here.

Do you have questions or need an individual offer? Do not hesitate to contact us.


    eBakery requires the contact information you provide to contact you regarding our products and services. You can unsubscribe from these notifications at any time. For information on unsubscribing, as well as our privacy practices and commitment to protecting your privacy, please see our Privacy Policy.*.

    • 0/5
    • 0 ratings
    0 ratingsX
    Very bad! Bad Hmmm Oke Good!
    0% 0% 0% 0% 0%

    Haben Sie Fragen oder brauchen ein individuelles Angebot? Zögern Sie nicht, uns zu kontaktieren.


      eBakery requires the contact information you provide to contact you regarding our products and services. You can unsubscribe from these notifications at any time. For information on unsubscribing, as well as our privacy practices and commitment to protecting your privacy, please see our Privacy Policy.*.

      Related Posts

      Leave a Comment

      Shopify Editions Winter 2024 UpdateShopify Produktattribute

      Hat dir der Artikel gefallen?

      Dann melde dich doch zu unserem Newsletter an!

      Neben unseren Blog Themen informieren wir dich darin regelmäßig zu neuen Features und Tutorials